


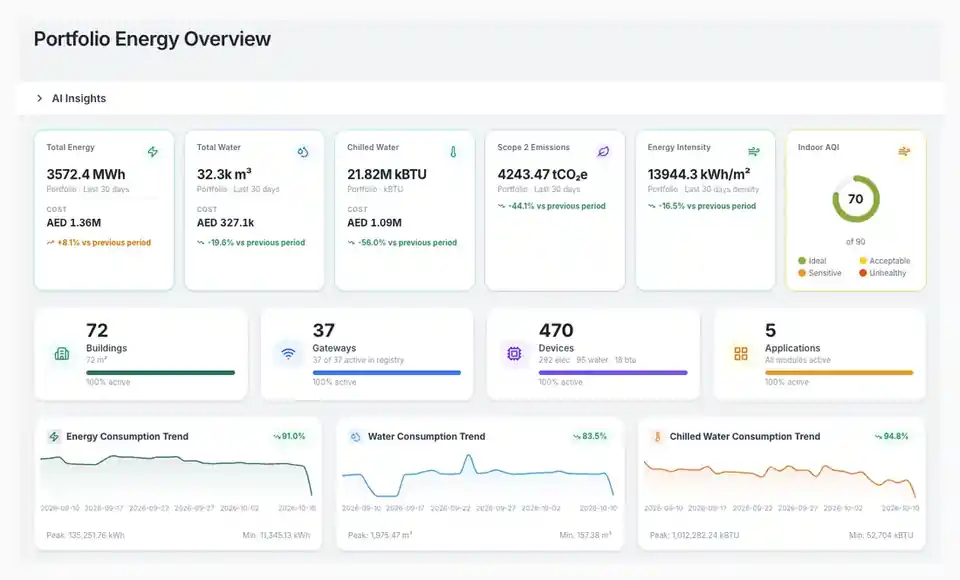
The Energy and Utilities module in BuildOT One is energy monitoring software. It shows how much electricity, water, chilled water and BTU energy your buildings use, what it costs and the carbon it creates. It turns meter data into dashboards, benchmarks and reports for single buildings and whole portfolios.
| Key fact | Detail |
|---|---|
| Module | Energy and Utilities |
| Part of | BuildOT One |
| What it does | Monitors consumption, cost and carbon, and benchmarks buildings |
| Data sources | Wireless smart meters and submeters (Class 0.5S), IoT telemetry, utility billing and tariff data |
| Integrations | BACnet, Modbus and MQTT |
| Typical users | Energy managers, facility managers, asset managers and finance teams |
What Energy and Utilities does
- Tracks consumption. See electricity, water, chilled water and BTU use by site, building and asset, live and historical.
- Explains cost. Apply tariff structures and allocate cost across tenants, cost centres and portfolios.
- Converts energy to carbon. Use configurable emission factors to report Scope 1 and 2 carbon.
- Benchmarks buildings. Compare sites with intensity metrics such as kWh/m2 and spot the underperformers.
- Links energy to equipment. Abnormal energy behaviour is tied to asset performance, which surfaces inefficiency and possible failures early.
- Finds load patterns. Time profiles show peaks and waste by hour, day and season, which matters in Gulf buildings where cooling can reach about 70% of peak load (PwC Strategy&).
Energy monitoring software features
- Portfolio, building and meter-level dashboards
- Heatmaps, trend charts and drill-down analysis
- Tariff and billing intelligence
- Carbon tracking with configurable emission factors
- Virtual meters that combine physical meters into zones or systems
- Forecasting and trend analysis
- Meter quality and diagnostics views
- Executive overview of energy, cost, carbon and performance across all assets
- Building-level analysis of consumption, anomalies and efficiency metrics
- Savings checks for energy conservation measures through Measurement and Verification
- Wireless metering that costs about 30% less than an RS485 retrofit (beachfront hotel in Ajman)
How does energy monitoring work in BuildOT One?
Wireless meters send readings over LoRaWAN (EU868) to BuildOT One, which shows live and historical use by building, floor and tenant. Because cooling can reach about 70% of peak load in Gulf buildings, hourly load profiles show where waste hides. At the Ajman hotel, wireless meters cost about 30% less than an RS485 retrofit.
Who uses it
Energy managers use it to find waste. Facility managers use it to explain consumption to owners. Asset managers and finance teams use it to allocate costs and compare buildings. Sustainability teams use it as the data source for carbon reporting.


Works with
- Sustainability and ESG for carbon and ESG reporting
- Measurement and Verification to validate savings
- Report Hub for scheduled energy reports
- Sustainability and energy products and gateways
- Related solution: Energy management
Frequently asked questions
What meters does the module use?
It works with wireless smart meters and submeters, including Class 0.5S meters, plus data from existing meters and utility billing sources.
Can it replace manual meter reading?
Yes, for connected meters. Readings flow into BuildOT One automatically, and manual inputs can be added where a meter is not connected.
Does it cover carbon?
It converts energy use into Scope 1 and 2 carbon using configurable emission factors, which supports data collection for ESG frameworks.
Can it work with meters I already have?
Yes. It connects over BACnet, Modbus and MQTT, so existing meters can feed the same dashboards as new wireless ones.
Explore all BuildOT One modules
See your energy data in one place
Share your meter list and we will map out what the module shows in the first month. Request a demo
